チャートライブラリの使い方(1)「基本編」
今回から何回かに分けてhifiveのチャートライブラリの使い方を紹介します。
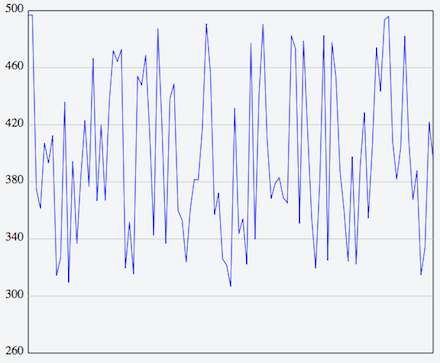
まず今回はごく基本的な折れ線グラフを描いてみます。
サンプルはこちらにあります。結果は次のようなグラフになります。
チャートライブラリの読み込み
チャートを描く際には通常のhifiveに加えて、以下のライブラリを読み込みます。
グラフを表示する
まずHTMLは次のようになります。
This file contains hidden or bidirectional Unicode text that may be interpreted or compiled differently than what appears below. To review, open the file in an editor that reveals hidden Unicode characters.
Learn more about bidirectional Unicode characters
| <div id="chart" ></div> |
次にJavaScriptの基本形です。 h5.ui.components.chart.ChartController を読み込みます。
This file contains hidden or bidirectional Unicode text that may be interpreted or compiled differently than what appears below. To review, open the file in an editor that reveals hidden Unicode characters.
Learn more about bidirectional Unicode characters
| var pageController = { | |
| __name: 'ui.chart.pageController', | |
| _chartController: h5.ui.components.chart.ChartController, // チャートライブラリ | |
| __meta: { | |
| _chartController: { | |
| // グラフを表示するdivタグのIDです。 | |
| rootElement: '#chart' | |
| } | |
| }, | |
| __ready: function(context) { | |
| // 表示処理を行います | |
| }; | |
| } | |
| h5.core.expose(pageController); |
続いて __ready の内容です。 series はダミーデータが入ります。配列で複数のデータを定義できます。
This file contains hidden or bidirectional Unicode text that may be interpreted or compiled differently than what appears below. To review, open the file in an editor that reveals hidden Unicode characters.
Learn more about bidirectional Unicode characters
| var series = [this._createNewSeries()]; |
その後はチャートコントローラの初期定義になります。表示範囲、表示方法などを定義します。
This file contains hidden or bidirectional Unicode text that may be interpreted or compiled differently than what appears below. To review, open the file in an editor that reveals hidden Unicode characters.
Learn more about bidirectional Unicode characters
| this._chartController.draw({ | |
| chartSetting: { | |
| width: 600, | |
| height: 480 | |
| }, | |
| axes: { | |
| xaxis: { | |
| off: true | |
| }, | |
| yaxis: { // y軸 | |
| lineNum: 6, // y軸の補助線の数(上部は含む) | |
| fontSize: '12pt', // ラベルのフォントサイズ | |
| autoScale: function(min, max) { // オートスケールの定義 | |
| return { | |
| rangeMax: Math.ceil(max / 500) * 500, | |
| rangeMin: 260 | |
| }; | |
| }, | |
| } | |
| }, | |
| seriesDefault: { // すべての系列のデフォルト設定 | |
| dispDataSize: 100, | |
| }, | |
| series: series | |
| // 系列データ | |
| }); |
ダミーデータを生成するメソッドです。系列データをオブジェクトで返します。
This file contains hidden or bidirectional Unicode text that may be interpreted or compiled differently than what appears below. To review, open the file in an editor that reveals hidden Unicode characters.
Learn more about bidirectional Unicode characters
| _createNewSeries: function() { | |
| var data = createChartDummyData(400, 100); // ダミーデータを生成 | |
| // 系列定義 | |
| return { | |
| name: 'series_1', | |
| type: 'line', | |
| data: data, | |
| propNames: { | |
| y: 'val' | |
| }, | |
| color: 'blue' | |
| }; | |
| } |
今回は折れ線グラフなので line としています。塗りつぶす場合には stacked_line が使えます(別途背景色も指定します)。線の色は青です。
ダミーデータを返している createChartDummyData には 400 と 100 という2つの引数が設定してあります。これは400を中心に±100(300〜500)のデータを生成します。生成されるデータは val というキーを持っています。
This file contains hidden or bidirectional Unicode text that may be interpreted or compiled differently than what appears below. To review, open the file in an editor that reveals hidden Unicode characters.
Learn more about bidirectional Unicode characters
| [ | |
| {val: 300}, | |
| {val: 420}, | |
| {val: 320}, | |
| : | |
| ] |
このようなデータ形式になっている必要があります。
今回のサンプルはこちらにあります。業務システムにおいてチャートはよく使われるものです。使い方を覚えてしまえばhifiveで簡単に描けるようになります。次回以降、このサンプルをベースに機能を追加説明していきます。
![]()

Trackbacks & Pingbacks
コメントは受け付けていません。